Current Activities
-
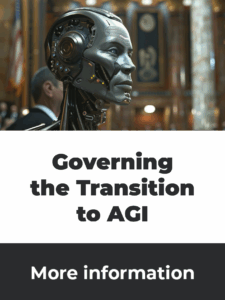
Artificial General Intelligence
- International Study of the Transition from Artificial Narrow (ANI) to Artificial General Intelligence (AGI) Governance: Phase 1 and 2
- Global Governance of the Transition to Artificial General Intelligence: Issues and Requirements
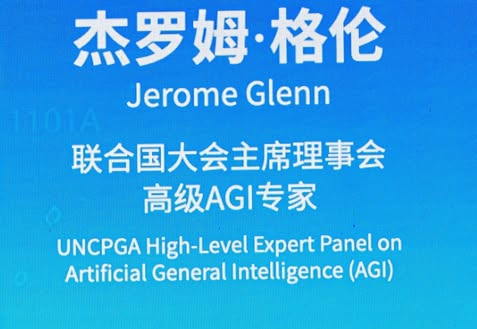
- Promoting the High-Level Expert AGI Panel report of the UN Council of Presidents of the UN General Assembly with political leaders.
- Working with the UN Council of Presidents of the UN General Assembly on its role on AGI Governance.
- Phase 3 of The Millennium Project research on AGI governance
-
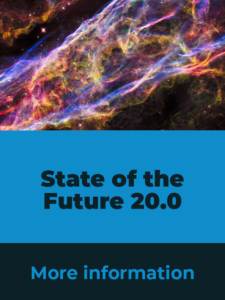
State of the Future 20.0
Promotion and translation of State of the Future 20.0 — English, Arabic, Italian and Spanish available now! A Romanian version is in the works. Executive Summary available in 16 languages!
-
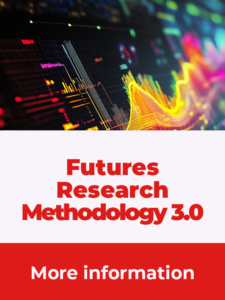
Futures Research Methodology 4.0
Updating Futures Research Methodology — Transitioning from version 3.0 to 4.0, with a projected release in early 2026.
Recent News
ABOUT THE MILLENNIUM PROJECT
Improve humanity’s prospects for building a better future.
The Millennium Project is a global participatory think tank founded in 1996 under the American Council for the United Nations University. It became independent in 2009 and has since grown to 72 Nodes worldwide.
The Millennium Project connects futurists around the globe to collaborate on improving global foresight.
Purpose
Improve humanity’s prospects for building a better future.
Mission
Improve thinking about the future and make that thinking available through a variety of media for feedback to accumulate wisdom about the future for better decisions today.
Vision
To create a global foresight network of Nodes, information, and software — a collective intelligence system recognized for its ability to improve humanity’s prospects. The Millennium Project is a think tank for the benefit of all humanity — not for a specific government, issue, or ideology, but for building a better future for everyone.
About The Millennium Project Nodes
A Millennium Project Node is a self-organizing group of institutions and individuals recognized by the Millennium Project. Each Node helps facilitate the Project’s research or conducts its own research to support the Project’s goals.
Nodes identify emerging global issues and opportunities, explore potential solutions, and develop methods to carry out this research.
Each Millennium Project Node:
- Takes the lead responsibility for a specific geographic area or topic.
- Has access to all Millennium Project resources, including staff, the information system, international panels, and other Nodes, to fulfill its responsibilities.
- Selects its own Chair, who manages the Node’s work and communicates with the Project’s coordinating office.
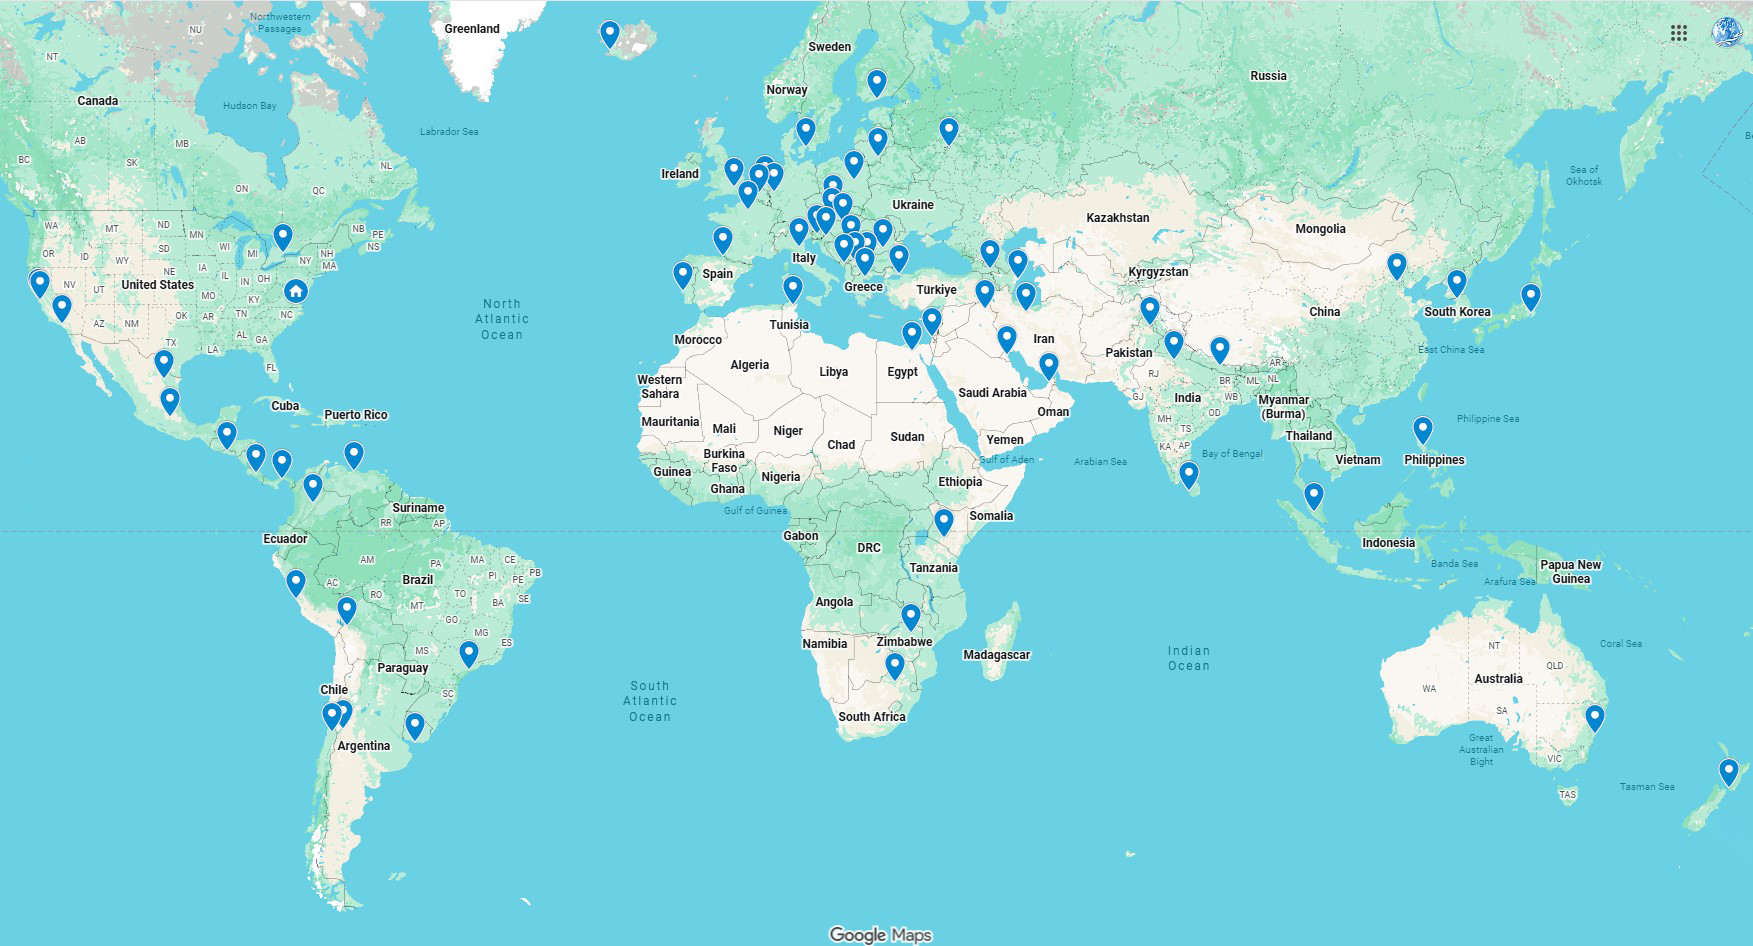
NEW! Explore the dozens of node initiatives around the world!
A pragmatic exploration of possible futures — choices and consequences — really exercised my imagination.
Vint Cerf, Internet pioneer,
Strategic planning for the planet; must reading for world leaders.
William Halal,
President, TechCast GlobalOne of the best studies of modern terrorism and what to do about it.
Jamie Shea,
Deputy Asst. Secretary General, NATOA high level, reliable intellectual compass for the conflict ridden, and uncertain world advancing toward the mid-century.
Mihály Simai,
Former Chairman, United Nations UniversityOutstanding report!
Jim Spohrer,
Director, Cognitive Opentech Group, IBMAn important example of using scientific methods and collective intelligence to help us understand and act better for the future.
Phil Mjwara,
Director General, Ministry of Science & Technology, South AfricaCertainly, the guide to make better decisions and achieve success.
Julio Millán,
President Coraza Corporación AztecaAuthoritative compendium of what we know about the future of humanity and our planet.
The Futurist,
Strategic Planning for the Planet… remarkably articulate and prescient
Willian Halal,
Foresight JournalAbsolutely worth the reader’s time… takes the reader much farther forward than most thinking.
Defense & Foreign Affairs Policy Journal,
So important for many people around the world.
Eleonora Masini,
former Secretary and President, World Futures Studies FederationGlobal intelligence on the future of the world in the palm of your hand
KurzweilAI News,
The State of the Future can make a difference in the world. Well done.
Wendell Bell,
Professor Emeritus, Yale UniversityA lucid, thought-provoking, strategically oriented exploration of the transforming world order.
Mihály Simai,
former Chairman, United Nations UniversityStrategic intelligence for business leaders.
Michael Stoneking,
Partner, Deloitte & Touche, LLP.Everyone, and I mean EVERYONE, should read this incredible document, period!
Technological Forecasting & Social Change,
The SOF report continues, year after year, to be the best introduction — by far — to a broad range of major global issues and long-term remedies.
Michael Marien,
Global Foresight BooksInvaluable insights into the future
Ban Ki-moon,
Secretary-General, UNA must for any decisionmaker with a long-term vision